SQL Tuning Health-Check Script
Reference: SQL Tuning Health-Check Script (SQLHC) (Doc ID 1366133.1)
The SQL Tuning Health-Check Script is a tool developed by the Oracle Server Technologies Center of Expertise. The tool, also known as SQLHC, is used to check the environment in which a single SQL Statement runs, checking checks Cost-based Optimizer (CBO) statistics, schema object metadata, configuration parameters and other elements that may influence the performance of the one SQL being analyzed.
This tool is not part of the database binaries and needs to be installed, here are the installation steps and how to use this tool.
Download and unzip sqlhc.zip from the doc id above.
[oracle@xxxx sqlhc]$ unzip sqlhc.zip
Archive:  sqlhc.zip
  inflating: sqldx.sql
  inflating: sqlhc.sql
  inflating: sqlhc_db.sql
  inflating: sqlhc_db_null.sql
  inflating: sqlhc_exit.sql
  inflating: sqlhc_pxhcdr.sql
  inflating: sqlhc_pxhcdr_null.sql
  inflating: sqlhc_sta.sql
  inflating: sqlhc_tcb.sql
  inflating: util_planx.sql
   creating: utl/
  inflating: utl/bde_chk_cbo.sql
  inflating: utl/coe_gen_sql_patch.sql
  inflating: utl/coe_gen_sql_profile.sql
  inflating: utl/coe_load_sql_baseline.sql
  inflating: utl/coe_load_sql_profile.sql
  inflating: utl/coe_xfr_sql_profile.sql
  inflating: utl/coe_xfr_sql_profile_remote.sql
  inflating: utl/flush_cursor.sql
   creating: utl/mon/
  inflating: utl/mon/0_mon_readme.txt
  inflating: utl/mon/1_mon_repository.sql
  inflating: utl/mon/2_mon_capture.sql
  inflating: utl/mon/3_mon_reports.sql
  inflating: utl/mvhcdr.sql
  inflating: utl/planx.sql
  inflating: utl/profiler.sql
  inflating: utl/pxhcdr.sql
  inflating: utl/readme.txt
   creating: utl/spm/
  inflating: utl/spm/alter_spb.sql
  inflating: utl/spm/coe_load_sql_baseline.sql
  inflating: utl/spm/create_spb_from_awr.sql
  inflating: utl/spm/create_spb_from_cur.sql
  inflating: utl/spm/create_spb_from_sts.sql
  inflating: utl/spm/create_sts_from_awr.sql
  inflating: utl/spm/create_sts_from_cur.sql
  inflating: utl/spm/display_awr.sql
  inflating: utl/spm/display_cur.sql
  inflating: utl/spm/display_spb.sql
  inflating: utl/spm/display_sts.sql
  inflating: utl/spm/drop_cur.sql
  inflating: utl/spm/drop_spb.sql
  inflating: utl/spm/drop_sts.sql
  inflating: utl/spm/evolve_spb.sql
  inflating: utl/spm/imp_and_unpack_spb.sql
  inflating: utl/spm/imp_and_unpack_sts.sql
  inflating: utl/spm/pack_and_exp_spb.sql
  inflating: utl/spm/pack_and_exp_sts.sql
  inflating: utl/spm/readme.txt
  inflating: utl/sqlhc_fc.sql
[oracle@xxx sqlhc]$
Go to the sqlhc folder and execute the script on sqlplus with sql_id you want to improve
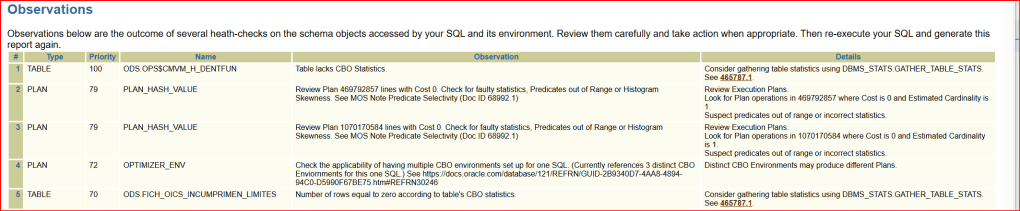
@sqlhc.sql T f1nttn3kna0puHow to interpret the results, on the main report: 1366133.1 SQLHC 23.2 (2024/12/28) Report: sqlhc_20250116_1150_f1nttn3kna0pu_1_main.html
In the Observations field, review the observation suggestions ordered by importance, as seen below.
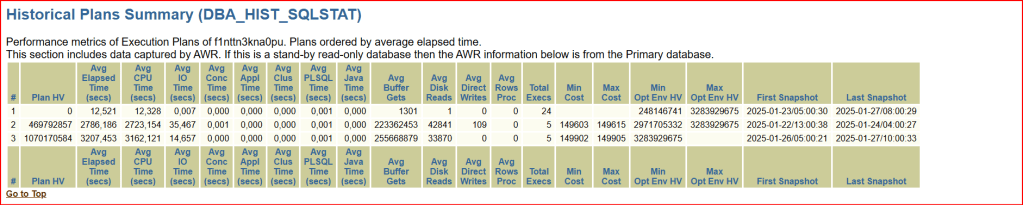
We have the “Plans summary” with the average elapsed time for the sql_id identified ordered by the PLAN HV (Plan Hash Value).
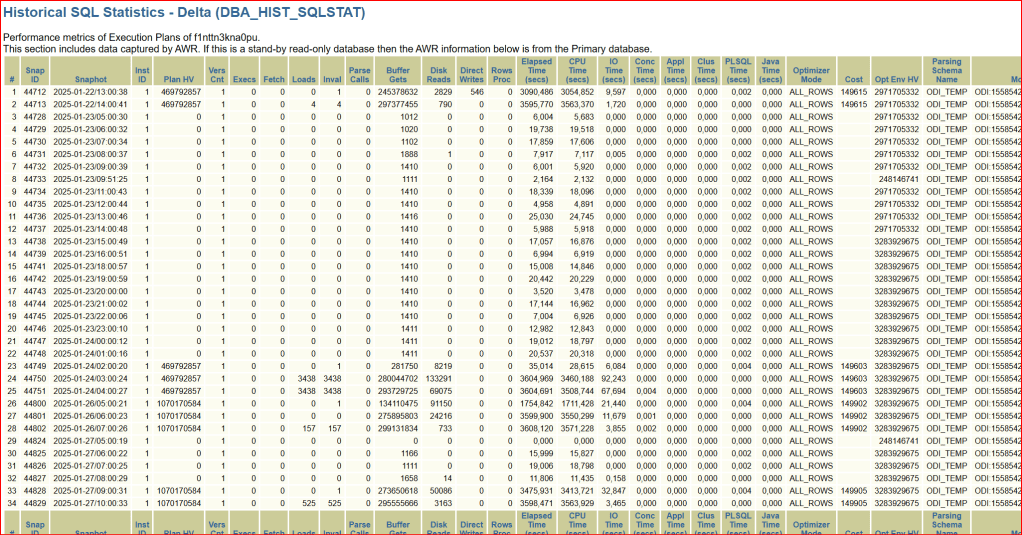
On the Historic SQL Statistics, we have the main data such as: Snapshot date, Plan Hash Value and execution time of this query with all related information on the other columns.
If in the recomendations there is a recommended SQL Profile that you could test, you can accept the profile recommended running this script:
execute dbms_sqltune.accept_sql_profile(task_name =>
'f1nttn3kna0pu_tuning_task', task_owner => 'SYS', replace =>
TRUE);
If this profile doesn’t help, it can be disabled or dropped as follows using the the SQL_PROFILE name returned from the query below:
select SQL_ID, SQL_PROFILE,PLAN_HASH_VALUE from V$SQL where SQL_ID='f1nttn3kna0pu';To disable the profile:
EXEC DBMS_SQLTUNE.ALTER_SQL_PROFILE(Name => '<SQL PROFILE>', Attribute_Name => 'STATUS', Value => 'DISABLED');To drop the profile:
EXEC DBMS_SQLTUNE.DROP_SQL_PROFILE(Name => '<SQL PROFILE>');If there is a suggestion to update statistics from a table that has no statistics or old statistics, run the statistics for this table
SQL> select owner,table_name, last_analyzed
from dba_tables where table_name='TOS3YMGREMQ000'  and owner='DIM_VIEW'  2
  3  ;

OWNER                          TABLE_NAME                     LAST_ANAL
------------------------------ ------------------------------ ---------
DIM_VIEW                       TOS3YMGREMQ000
 execute dbms_stats.gather_table_stats(ownname => 'DIM_VIEW', tabname =>
            'TOS3YMGREMQ000', estimate_percent =>
            DBMS_STATS.AUTO_SAMPLE_SIZE, method_opt => 'FOR ALL COLUMNS SIZE
            AUTO');


Leave a comment